Making Cents of Charity: Admin costs - Is 30% too much, or not enough?
Bronwyn Rideout - 30th September 2026
For every dollar you donate to charities, a portion is usually directed towards covering administrative and fundraising costs. What is the maximum percentage that is acceptable to you? The rule of thumb is a fundraising efficiency ratio of 30:70 - 70% to programming, and 30% to overheads (including fundraising, management, and other general costs). However, amongst charity watchdogs and monitors such as CharityWatch, Charity Intelligence Canada, and the Charities Review Council, a charity is considered financially efficient, or at least performing satisfactorily, if overhead spending is between 20 and 35%, with between 65 and 80% distributed to programmes. Some charities and non-profit trade organisations argue that excessive focus on financial overhead can cause harm, and can actually have an overall detrimental effect on programme investment. However, how overhead spending is calculated and communicated varies, and from some charities the amount deducted from donations for admin and fundraising is less than their true costs.

What is overhead?
A variety of things can be considered to be overhead costs: rent, salaries, IT, office supplies, printing, legal services, governance, and so on. But does high overhead necessarily mean that a charity is a failure? The Australian Charities and Not-for-profits Commission (ACNC) provides this apt example of when the burden of overhead costs may be sidestepped:
“Because charities operate in different ways, and have different purposes, it can be inaccurate to use administrative costs as a way to compare the impact or effectiveness of a charity.
For example, a charity that provides health services in the inner city may have higher administration costs (rent, staff costs, equipment) than a charity that runs a temporary meal service for the homeless in regional communities (using food donations and not having to pay rent).”
You can probably think of examples of how some church-based charities might derive more advantages from the latter scenario than many secular ones. High administrative costs are not immediately a sign of inefficiency or ineffectiveness; it may merely be a necessity of doing business, and an indication of the absence of an in-built financial safety net provided by a wealthier parent organisation. Recent conference attendees may recall Dr Andy Vonasch’s talk, but unusually low or no overhead may be viewed suspiciously, and even a sign of possible mismanagement. Multinational accounting firm RSM quoted Susan Hitch on this matter:
“I’m often worried if a charity claims very low admin costs. Either they’re fudging it to try to please a funder, which doesn’t promise much of a relationship, or their admin really is rock bottom, in which case they’re unlikely to be well run. You can’t run an effective organisation with barely any cost. Grants are usually more effective if the charity is spending a realistic amount on its core costs.”
Further complicating this matter is that what constitutes an administrative cost for one charity may be a programme expense for another. Travel expenses for a medical charity like The Red Cross and Doctors Without Borders can easily be understood as a programme expense the majority of the time, compared to groups like your local Hospital foundation or Friends of the local library, where travel would be considered an administrative or fundraising cost.
Even more of an accounting nightmare is how a single cost for a charity might be divided across its programme, management, and fundraising categories. A 2014 article by Jan Masaoka and Steve Zimmerman for Blue Avocado described how rental costs may be so allocated:
“…if you rent a community center auditorium to serve senior lunches, it’s a Program expense. If you rent a separate office for your admin offices, that’s a Management & General expense. If your grant writer works out of shared Hub space, that’s a Fundraising expense. If they all share offices, the rent is a shared cost, and can be apportioned by a variety of acceptable methods…”
To their credit, many of the charities I’ve discussed in this series, such as World Vision and Child Fund, actually score quite favourably on their financial efficiency as measured by various charity watchdogs. Not that this makes up for past controversies, but it is important to acknowledge the maximising of donor dollars when it is occurring.
Inconsistent Calculations
There is no single formula that the charity watchdogs/monitors follow to determine their efficacy assessments. CharityWatch claims that charities may divide their fundraising expenses by their total revenue and achieve an erroneously low figure for their rate of fundraising efficiency:
$100,000 Fundraising Expense ÷ $1,000,000 Total Revenue = 10%, or $10 to raise $100
However, Charities and Not-for-Profits can have revenue sources that are unrelated to fundraising. So, what CharityWatch does instead is compare that expense with how much the charity is spending to get cash and non-cash contributions, not total revenue:
$100,000 Fundraising Expense ÷ $200,000 Related Contributions = 50%, or $50 to raise $100.
The implications this has on valuation of non-cash donations and the perception of efficiency is explained further here. Charity Intelligence Canada appears to have a similar algorithm to CharityWatch:
“Total fundraising costs are presented as a percent of donations plus special events revenue.”
Although, to be clear, Charity Intelligence Canada combines fundraising and administrative costs when assigning a rating to a charity.
The Charities Review Council merely states that 65% of total expenses should be used for programming. Charity Navigator also leans more to programme expenditure:
“While Charity Navigator emphasizes a preference for 70% or more of expenses to be directed towards programs, we don’t assign additional points for organizations with lower overhead. We see no evidence that a program expense ratio of greater than 70% leads to greater impact.”
The Nonprofit Starvation Cycle
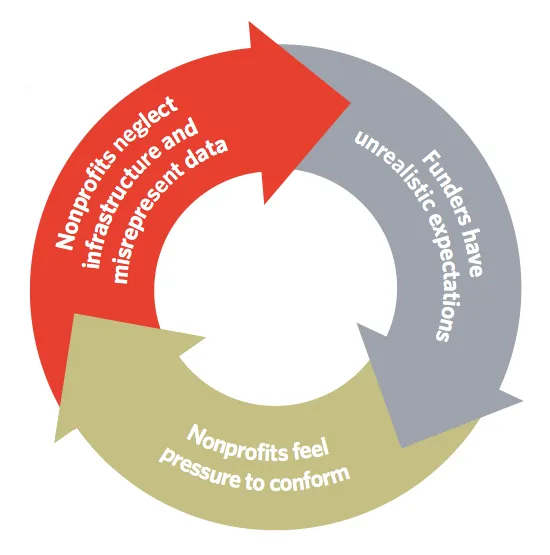
Of course, charities and nonprofits are motivated to get donors to accept higher or fluctuating overheads, but there are also donors that insist 100% of donations should go to programming and everything else should be done by volunteer hours or gifted to the charity, which is admittedly also unreasonable for some of some of the work that charities do. This mismatch forms the basis of the nonprofit starvation cycle - a controversial concept. Nonprofits argue that obsessing or persistently chasing low overheads can undermine a charity’s ability to meet its mission, due to underinvestment or commencing programmes that meet donor wants rather than recipient needs. Anecdotally, overhead costs have increased. Rent and wages are obvious examples, but IT and its related infrastructure are a whole new class of expenses that did not exist for many nonprofits until the 1990s. Eleanor Cator, writing for Community Foundations of Aotearoa NZ, notes that Dan Pallotta’s 2013 TedTalk on this subject led to watchdogs CharityNavigator Guidestar, and the Better Business Bureau dropping overhead ratios as a measurement.
But not all charity monitors were on board with this change. Laurie Styron of CharityWatchdog argued that excluding overhead efficiency from charity ratings was problematic. Styron is correct in pointing out that alternative measures of efficiency, like programme impact, are hardly objective, with success facilitated by thousands of variables. Nor should charities accept high overheads for an uncertain future where the donor pool has become sufficiently large and self-sustaining that it can compensate for persistent high overhead costs. However, Styron’s stance is that groups supporting the existence of the starvation cycle want to run organisations with high costs and low returns, whereas the counterarguments are that donor or funder forced austerity threatens survival via the hiring of underqualified persons, since non-profits are often priced out of hiring experienced talent, and forced to use out-of-date infrastructure that is costly to maintain and inefficient to run.
In my opinion, this is one of the instances when neither side is completely right or wrong. All of the charity watchdogs have organisations in their databases that are financially inefficient and ineffective. In turn, charities regularly face scenarios where donors have explicitly earmarked donations for projects, also known as restricted giving, that have concluded, do not meet the organisation’s priorities at that time, or have strictly forbidden any expenditure on overhead. A study by Altamimi and Liu in 2021 examined how this trend held up for US Arts and Culture nonprofits from 2008-2018. The authors found that there were issues on both extremes: Low overhead did impact programming, but high overhead was an indication of inefficient management. Still, Altamimi and Liu found that 35.2% was the optimal overhead expenditure, which is at the upper end of overhead acceptability.
How do charities fund fundraising?

Funding for fundraising campaigns can come from many sources, including bequests, gifts-in-kind, investments, grants, endowments, restricted and unrestricted contributions, and sales revenues. If donors don’t put any restrictions on their donation, then a portion of the funds donated may also be tapped to cover ongoing or future fundraising campaigns. Some charities do list what percentage of a donation is directed to both fundraising and admin costs.
Doctors Without Borders illustrates what happens with the fundraising cap. Fundraising accounts for 14% ($121,953,219 ) of Doctors Without Borders USA’s total expenses in their 2025 report. Since 1995, the charity has committed to allocating more than 85% of its expenditure to programmes, and publicly states that 14% of donations go to fundraising and 1% to admin. In 2025 they raised $507,427,981 from individual donors, and had a total revenue of $848,821,781 from all revenue streams. If 14% fundraising expenditure was applied to the fundraising revenue, then they would only have $71,039,917.34 towards matching 2025’s fundraising budget, and would need to make up the $50,000,000 difference from the other revenue sources. This would be about 15% of the total revenue from other sources. However, this would hardly topple the charity over.
World Vision states that 86% of its total operating expenses was for programmes, but does not share which portion of the donations was reinvested into fundraising. In 2025, they had $1.4 billion in operating revenue derived from grants, private donations, cash and non-cash grants. $633,616,000, or 45% of total revenue, came from primarily private cash contributions, both restricted and unrestricted. Fundraising expenses were $144,263,000, which was 10% of total expenses, and when combined with general and management costs, total overhead was just 14%. The financial reports do not make it clear exactly how fundraising campaigns were funded, but it does show how it was distributed:
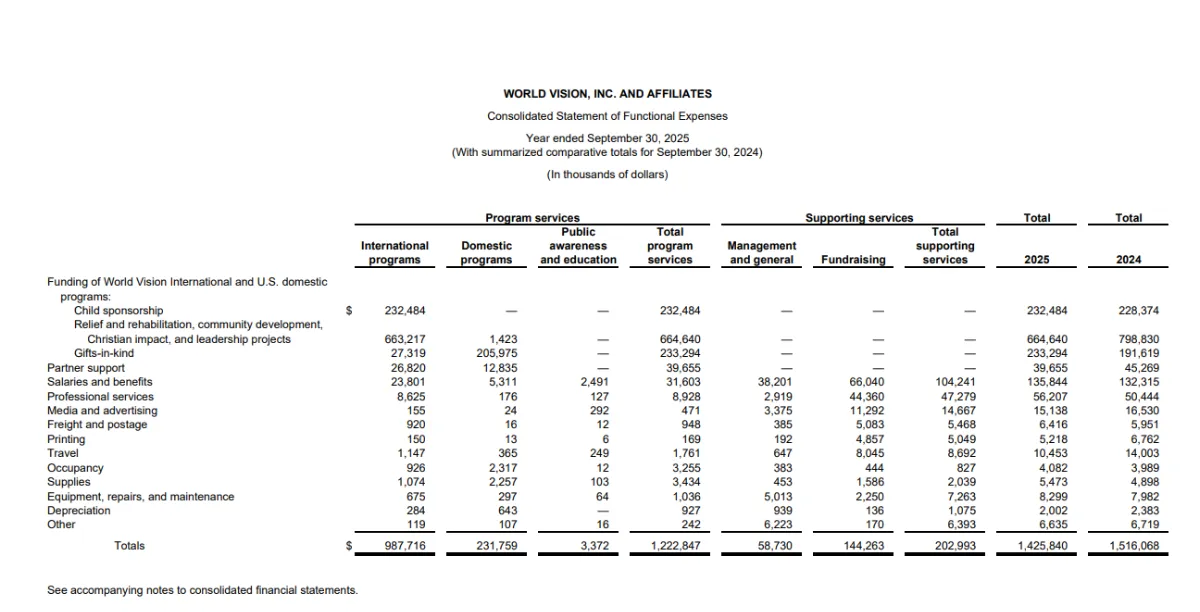
World Vision 2025 Consolidated Financial Reports
For the purpose of illustration, let’s presume that the entire fundraising revenue of $633,616,000 had no restrictions regarding overhead. If 10% of this revenue was to be reinvested back into fundraising, then $63,361,600 would come from fundraising revenue, and more than 50% would need to come from other revenue streams. Due to the lack of differentiation between the sources of contributions, it is difficult to assess financial efficiency at a level where donors could feel confident to explain how much of their donation by the dollar will go to people in need. How is a $1 million dollar advance to a Christian music band allocated? Is it a fundraising cost, or does it go under administration as a marketing cost? On the other hand, for charities of this size, the sizable total revenue amount may make the question moot, because other revenue streams can completely cover fundraising costs. And, given the numbers World Vision brings in, that amount may not even be a blip in the financial report, as it is .007% of its $1.4 billion operating revenue - and an utter bargain if the charity can make $3-4 million from that initial $1 million investment.
In November/December, I will come back with the final part of this series, which will look at the trend of Live Aid, BandAid and World Vision’s role in creating Do they know it’s Christmas?