More variables please (with sprinkles on top)
Katrina Borthwick - 30th September 2024
As part of my postgraduate Psychology course, I had to take a course called Multivariate Data Analysis.
God it was awful.
Every time I tried to read the textbook I fell asleep. But I had to pass this horrible course to get my postgrad, and there was no way on earth that I wanted to fail it and end up having to do it again. In the end I managed to get through the work and passed… barely, with a C+. I was actually pretty good at maths in school, but this course was a whole other level of hell.
Despite my lack of enthusiasm for the topic, it turns out that multivariate data analysis is really important when we are trying to understand real world data, and in helping us to avoid connecting the wrong dots.
I’m going to explain why, very briefly why, this is the case, but just bear in mind I barely passed. I apologise profusely to any mathematicians reading this. Reader discretion is advised.
In a nutshell, multivariate data analysis enables other people (not me please) to analyse data containing more than two variables. It allows patterns to be identified between these multiple variables. For example, where variables tend to vary together in the same direction (or not), or the combined impact several variables may have on others. It also allows us to mathematically control for one or more variables, so we can learn more about the impact of those that remain. More on that later.
Does rainbow flavoured ice cream make us happier?
I find it is helpful to use an example when explaining things, especially if that example includes something I like to eat. So let’s see if we can work out what flavour of ice cream makes people happier – ‘rum and raisin’ or ‘rainbow’.
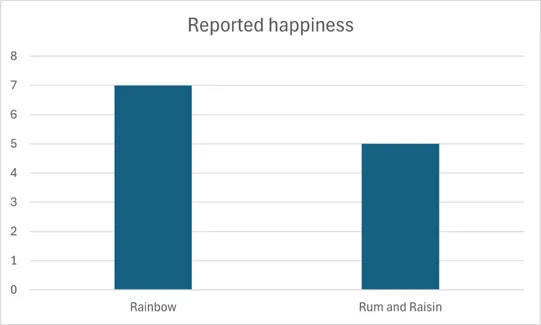
Without multivariate analysis we can analyse two variables. A two-variable analysis, for example, allows us to do a simple comparison between ice-cream flavour and reported happiness. In this comparison we might find that people who eat ‘rainbow’ flavoured ice-cream report a higher level of happiness than people who eat ‘rum and raisin’ ice cream.
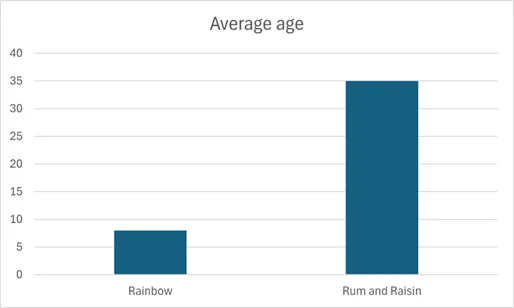
However, once we introduce a third variable, the situation gets more complicated. For example, if we introduce ‘age’, we may find that the older people tend to eat the ‘rum and raisin’ flavour, whilst the younger people under 12 years old eat ‘rainbow’ flavoured ice cream. So now we can say that rainbow ice-cream is associated with being happier, being under 12 is associated with being happier, and being older or eating rum and/or raisin ice-cream are associated with being less happy.
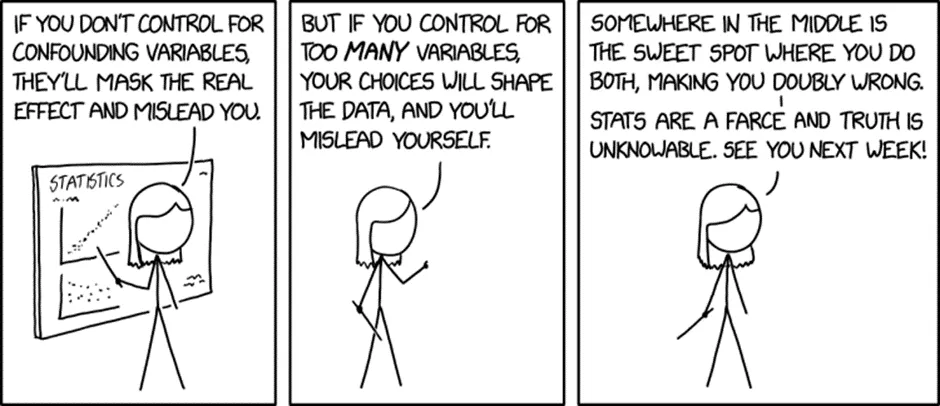
It’s hard to know what effects are important here, and that’s why in research scientists often try to control for as many variables as possible. For example, in this case we may decide to only survey adults ages 18-64 to try to control for any age affects. The downside of that is now we don’t have any data on kids! Also, what if we are interested in whether age contributes to happiness…
Ok, now add another variable such as ‘household income’, and perhaps the ‘price’ of each kind of ice-cream, and it gets even more complicated. We also suspect those aged over 65 may be less likely to be in ‘good health’ – yet another variable. Do people who are more well-off buy more or less ‘rum and raisin’ ice cream, and are they happier? Are older people in poorer health and also more likely to buy ‘rum and raisin’ ice cream?
So now we have an ever-increasing pool of variables, and it is entirely possible (even likely) that ice-cream flavour has nothing much at all to do with happiness, and that there are a bunch of other variables in the world that are more relevant to how happy we are.
None of this tells us anything about causation. It is just correlational data and there are too many variables, including those that we haven’t identified yet, interfering with our outcome. This information is effectively useless. Any conclusions we draw will be bunk. That’s where multivariate data analysis comes in.
Clustering
To unravel data, there are two main types of multivariate analysis. Ones that test dependence, and ones that test interdependence. Dependence won’t help us much here, as it is used for variables where one variable can predict another to some degree – for example ‘weight’ may be predicted by ‘height’ and ‘age’.
The interdependence tests are what we want for our data, and those tests are useful for looking at how each of the variables impacts others. For example, it can help us identify what combination of the variables have a statistically significant effect on happiness.
Statistically significant means that the outcome is unlikely to have happened by chance – usually we want to be able to say that we are 95% that the outcome we are seeing didn’t just happen by chance. If there is a decent chance our result could have occurred anyway, irrespective of what we are measuring – then it doesn’t tell us much.
So, using multivariate techniques, we might find that when some of the variables are grouped together (such as household income, the price of ice cream, health and age) they are associated with a statistically significant change in our target variable, in this case ‘happiness’.
A more well-known example of this is the Big Five personality traits. They are based on clustering the most powerful traits that have been found to work together to predict behaviour – those clusters of variables are called extroversion, agreeableness, openness, conscientiousness, and neuroticism. The Big Five model dates back to the 1940s, but there are lots of other personality models trying to do the same thing.
So which ice cream leads to world happiness
So, back to our ice-cream example, which by now seems to have got way out of hand. Our question turned out to be much bigger than we expected.

Our first step will be to identify all the variables that could potentially contribute to happiness. Remember, if we leave something out, it could be the variable that is really important to happiness, and our data will be useless or misleading. No pressure here.
Once we have all the possible contributors to happiness, our great grandchildren can ensure there are measures for all these variables, and then hopefully our distant descendants are more enthusiastic about multivariate data analysis than I am, and can cluster the data and find out what combination of worldly factors correlate with happiness.
If this sounds a little over the top, don’t despair. There is already some research out there, but spoiler – it’s probably not anything to do with ice cream.
These guys did it (sort of). Their analysis “confirmed two latent factors that impact happiness: household and societal happiness.” So basically, happiness is associated with two types of happiness. OK ……
More helpfully, this study of countries with low GDP found ‘income’ was associated with happiness, up to a certain level, and some social factors such as GDP, social support, healthy life expectancy, freedom to make life choices, perceptions of corruption, and generosity were also relevant.
There is also a European multivariate model that found being married, being educated, and being affluent are all positively associated with happiness.
Conclusion
Unfortunately, I can’t tell you much about ice-cream flavour and happiness. Our question was too big. Perhaps next time we will just ask people which ice cream flavour they prefer.
However, it’s obvious there can be problems with poorly defined questions and overly simplistic claims. It is important that even if a two-variable analysis appears to show evidence for a particular finding, we need to consider whether there might be other variables influencing what we see. It really is quite rare to see a simple two-variable correlation on something complex, outside of a lab.
Enjoy your rum and raisin ice cream while you can. You aren’t getting any younger.